Impacted Members/Scientists: Request a membership waiver, seek meeting support, and other resources. Learn more. For the latest public policy updates, please visit this page.
29 July 2025
New Data-Driven Investigations from Rubin Observatory
Ardis Herrold NSF–DOE Vera C. Rubin Observatory/NSF NOIRLab
Welcome to the AAS Education Committee Blog! Our blog features posts from astronomers and educators in the extended AAS community, curated by the AAS Education Committee. Subscribe here to receive future posts and other astronomy education news directly into your inbox every two weeks; also follow us on Bluesky and Instagram. We welcome guest article submissions! — AAS Education Committee.
The NSF–DOE Vera C. Rubin Observatory’s Education and Public Outreach (EPO) team has created a suite of seven free, online investigations tailored for beginning learners, from advanced middle school through introductory college astronomy (Astro 101). This post highlights key elements from two investigations presented at the 245th AAS meeting in January 2025. These two investigations are Stellar Safari and Exploding Stars, and we invite all interested educators to make use of these investigations in their classrooms.
Rubin Observatory unveiled its first public images and data products during the First Look event in June 2025. While commissioning continues, full science operations are anticipated to begin later this year. Development of the classroom investigations began in 2018, led by a team of veteran educators, education researchers, and data scientists. Each activity was tested by more than 5,000 teachers and students. Topics were selected by educator focus groups and prioritized based on their potential to effectively showcase Rubin data. (Currently, all seven investigations rely on data from other surveys; they’ll be updated as Rubin data becomes available.)
Like Rubin’s wide-field imagery, the educational program aims to deliver accessible, time-efficient, and high-impact classroom experiences. Designed for cloud-based delivery, the investigations require no downloads or specialized software. Each is accompanied by a teacher guide, a short introductory video, a warm-up phenomenon, and six customizable formative and summative assessments. All components are aligned with the three-dimensional learning approach of the Next Generation Science Standards.
The investigations’ interactive structure is built to foster engagement across diverse student populations, supporting inclusive and equitable learning. Built-in visualization and analysis tools allow students to interact with real data online, following the modern model of “bringing software to the data.” Datasets are curated and pre-processed to ensure that an investigation can be completed in two hours or less. The design goal is to parallel current scientific practices while also expediting tasks that are tangential to the scientific and mathematical models being developed, such as requiring students to perform extensive calculations or spreadsheet manipulations.
These inquiry-based activities emphasize conceptual understanding through scaffolded data-driven discovery. Rather than acting as digital worksheets with predetermined answers, the investigations mirror the open-ended nature of scientific inquiry, where claims must be backed by evidence and sound reasoning. Randomized datasets ensure that students analyze unique objects, and reflection questions and tasks help connect astronomy content to students’ personal experiences.
The Stellar Safari investigation invites students to explore stars in their “natural habitats” — star clusters. Rather than attempting to make sense of a textbook H-R Diagram, which contains derived units arranged on a non-intuitive graph, students use color–magnitude diagrams, and students learn how stellar properties and lifecycles relate to observable data. By analyzing apparent magnitudes and comparing main sequence stars, learners uncover the core concept that a star’s initial mass determines its fusion rate and, in turn, all other key properties. In the second half of the activity, students fit isochrones to determine cluster ages and distances.
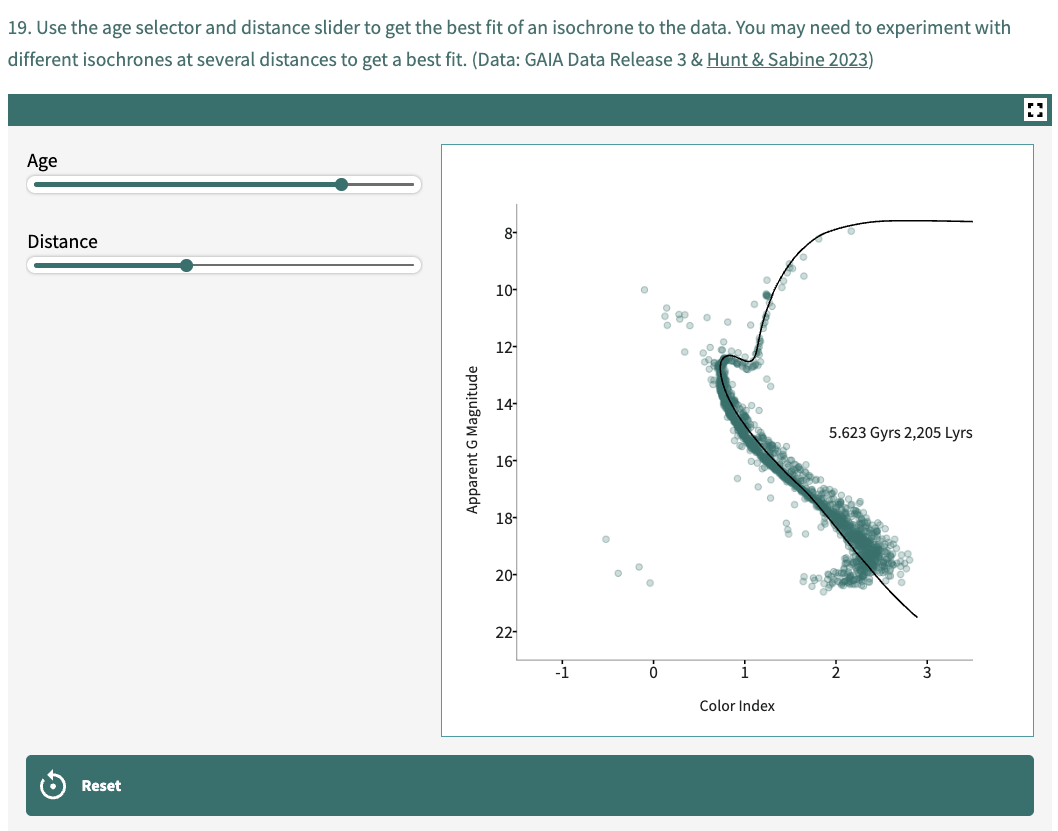
The plot shows an isochrone fit to the data and displays an age of 5.623 Gyrs and a distance of 2205 light-years.
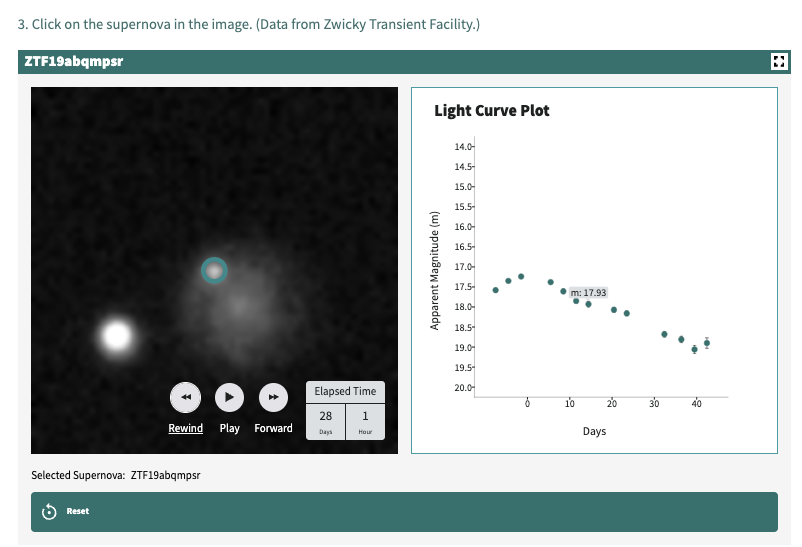
In Exploding Stars, students examine images and light curves of supernovae, then calculate galaxy distances using Type Ia supernovae. This investigation includes the sometimes overlooked step of standardizing peak brightness using the Phillips relationship before calculating distance.
Both investigations include features to support blind and low-vision users, such as an auditory curve-fitting tool that announces fit accuracy. A new option also allows students and educators to create accounts for saving progress more easily.
These tools have been successfully implemented in classrooms of all sizes, as well as in online, hybrid, and informal learning settings, such as after-school clubs. Each activity is accompanied by a robust teacher guide full of tips, background content, and practical strategies — empowering any AAS member, from amateur astronomers and graduate students to researchers and homeschool educators, to use these resources confidently.
Rubin EPO is committed to supporting astronomy educators over the next decade. Explore all resources at rubinobservatory.org/education, or reach out with questions at [email protected].